
KONE 2015 | SUSTAINABILITY REPORT
CREATINg ADDED VALUE
37
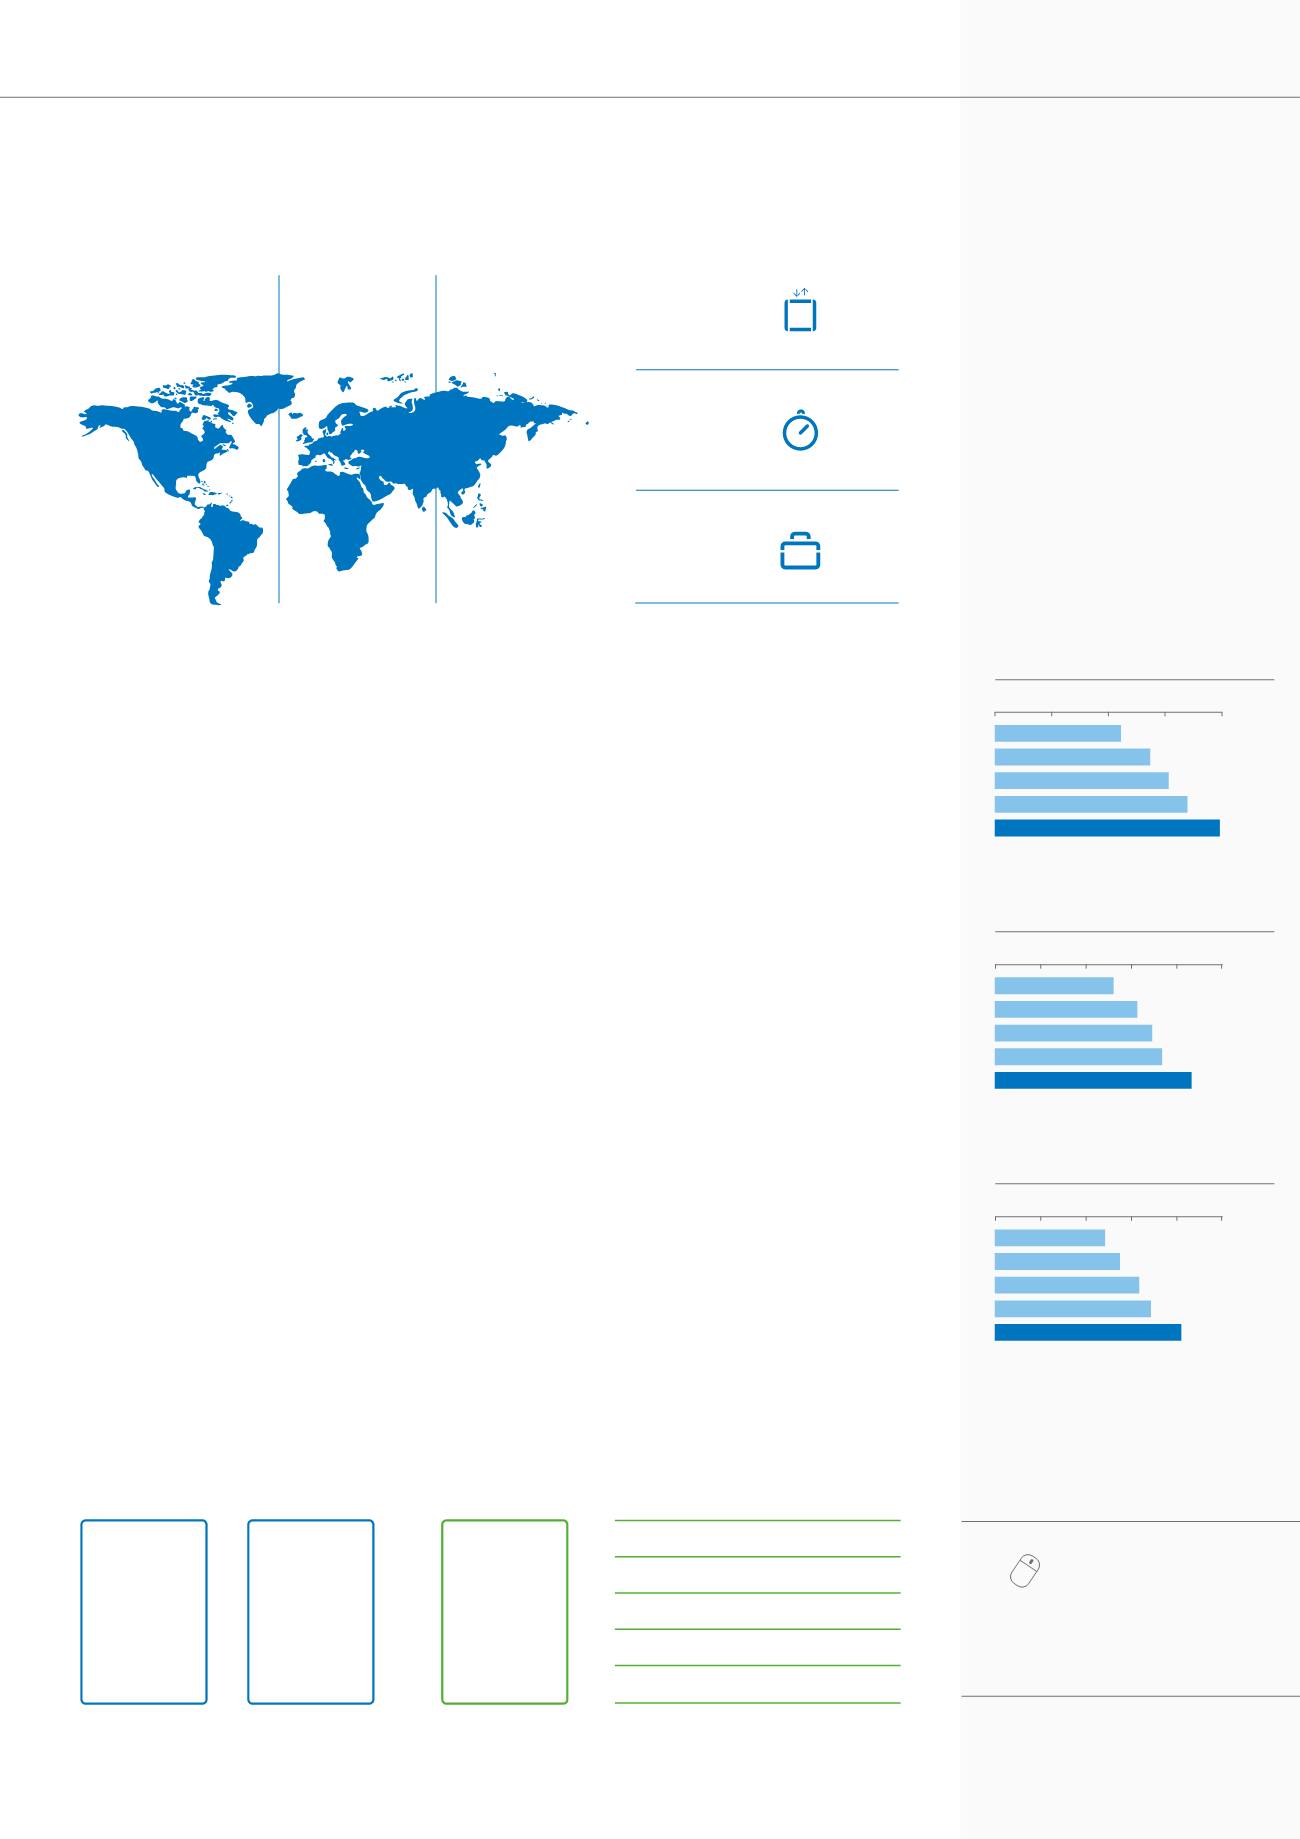
In terms of geographical distribution, 39% of
net sales came from the EMEA region (Europe,
Middle East and Africa), 17% from Americas and
44% from Asia-Pacific. China, the United States
and France were the largest individual countries
in terms of sales. China’s share was close to 35%
and the United States’ share was close to 15% of
total net sales in 2015*.
KONE’s operating income (EBIT) increased,
reaching EUR 1,241 million (1–12/2014: 1,036
MEUR) or 14.4% (14.1%) of net sales in 2015.
Operating income grew driven by positive
development in both the new equipment and
service businesses. The growth was driven
by broad-based positive development across
geographical regions. Favorable translation
exchange rates clearly contributed to the growth
in operating income with a positive impact of
approximately EUR 120 million.
KONE’s financial position was strong at the end
of December 2015. The cash flow generated
from operations in 2015 during January to
December 2015 before financing items and
Customers
8,647
(7,334)
MEUR
Suppliers
4,960
(4,198)
MEUR
Added value
3,687
(3,136)
MEUR
- =
Stakeholders
KONE’s economic impacts in 2015
Employees
1,825
(1,578) MEUR
Creditors
-122
(-19) MEUR
Public sector
932
(765) MEUR
Shareholders
718
(616) MEUR
Economic value
retained in the company
334
(196) MEUR
(2014 figures in brackets)
LONg-TERM FINANCIAL TARgETS
gROWTH:
Faster than the market
PROFITABILITY:
16% EBIT margin
CASH FLOW:
Improved working capital
rotation
Read more
about KONE’s financial
performance from our Financial
Statements 2015 available at
kone.com/en/investors.taxes was strong at EUR 1,474 million (1–12:
2014: 1,345 MEUR). The cash flow was driven
by growth in operating income and continued
favorable development in net working capital.
Creating stakeholder value
Our strong financial performance in recent
years has enabled us to generate stakeholder
value for our customers, suppliers, employees,
local communities and shareholders alike.
Shareholders
KONE’s strong financial performance has made
it possible for the company to offer increasing
dividend payments. For 2015, the dividend
distributed to shareholders increased by 16.7%
compared to the previous year. In total, KONE
distributed almost EUR 720 million in dividends
for the financial year 2015. Also with a longer
term perspective, our track record on dividend
distribution has been sustainable. KONE has a
strong shareholder base and had over 56,000
shareholders at the end of December 2015.
(Dec. 2014: over 51,000 shareholders.)
EMEA
39%
Americas
17%
Asia-Pacific
44%
Sales by market 2015
Sales by business 2015
New equipment
57%
Modernization
12%
Maintenance
31%
Our geographic regions are Europe, the Middle East and Africa (EMEA), Americas, and Asia-Pacific. The service business
accounts for around 40% of KONE’s revenue, while the new equipment business represents the remaining close to 60%.
Orders received 2011-2015
0 2,000 4,000 6,000 8,000
4,465
2015
2013
2014
2012
2011
5,496
6,151
6,813
7,959
Sales 2011-2015
0 2,000 4,000 6,000 8,000 10,000
5,225
2015
2013
2014
2012
2011
6,277
6,933
7,334
8,647
Operating income 2011-2015*
* excluding one-time items
0 300 600 900 1,200 1,500
725
2015
2013
2014
2012
2011
829
953
1,036
1,241
*For a list of KONE’s top 10 countries by sales, please see page 38.


