
KONE 2015 | SUSTAINABILITY REPORT
OUR PEOPLE
35
*Excluding United States.
Employees, 2015
Total number of employees, year end
49,734
Share of women in employees, %
12
Share of women in management teams (top 492*), %
18
Share of women in the Executive Board, %
14
Share of women in the Board of Directors, %
38
Total turnover rate, %, compared to 12 month average headcount
6.88
gender distribution per market, 2015*
EMEA
Men
86%
Women
14%
Asia Pacific
Men
89%
Women
11%
*Excluding Americas
continuous consultation and communication
on important developments affecting KONE
employees.
In 2015 the theme of the Forum was
service business development in a changing
environment. 20 employees from 14 European
countries participated.
Employee agreements are managed on a
national level, and there are differences in
national legislations. Approximately 40% of
KONE’s employees are covered by collective
bargaining agreements.
Encouraging interaction
At KONE, we believe employee engagement
is built on open and timely communication
about the company’s goals and ways of doing
business. We use multiple channels to interact
with employees, to motivate them, and to
encourage collaboration.
KONE’s global intranet, for example, acts as
both a news channel for all the latest news and
events and a virtual teamwork site. This KONE
Collaboration Workplace improves document
sharing and supports interaction.
The latest KONE news is also shared through
employee magazines and both global and local
newsletters. In 2015 KONE published 2 editions
of its global employee magazine Move in nine
different languages.
Employees per contract type, 2015
% of employees with Permanent contract
98
% of females with Permanent contract
97
% of males with Permanent contract
99
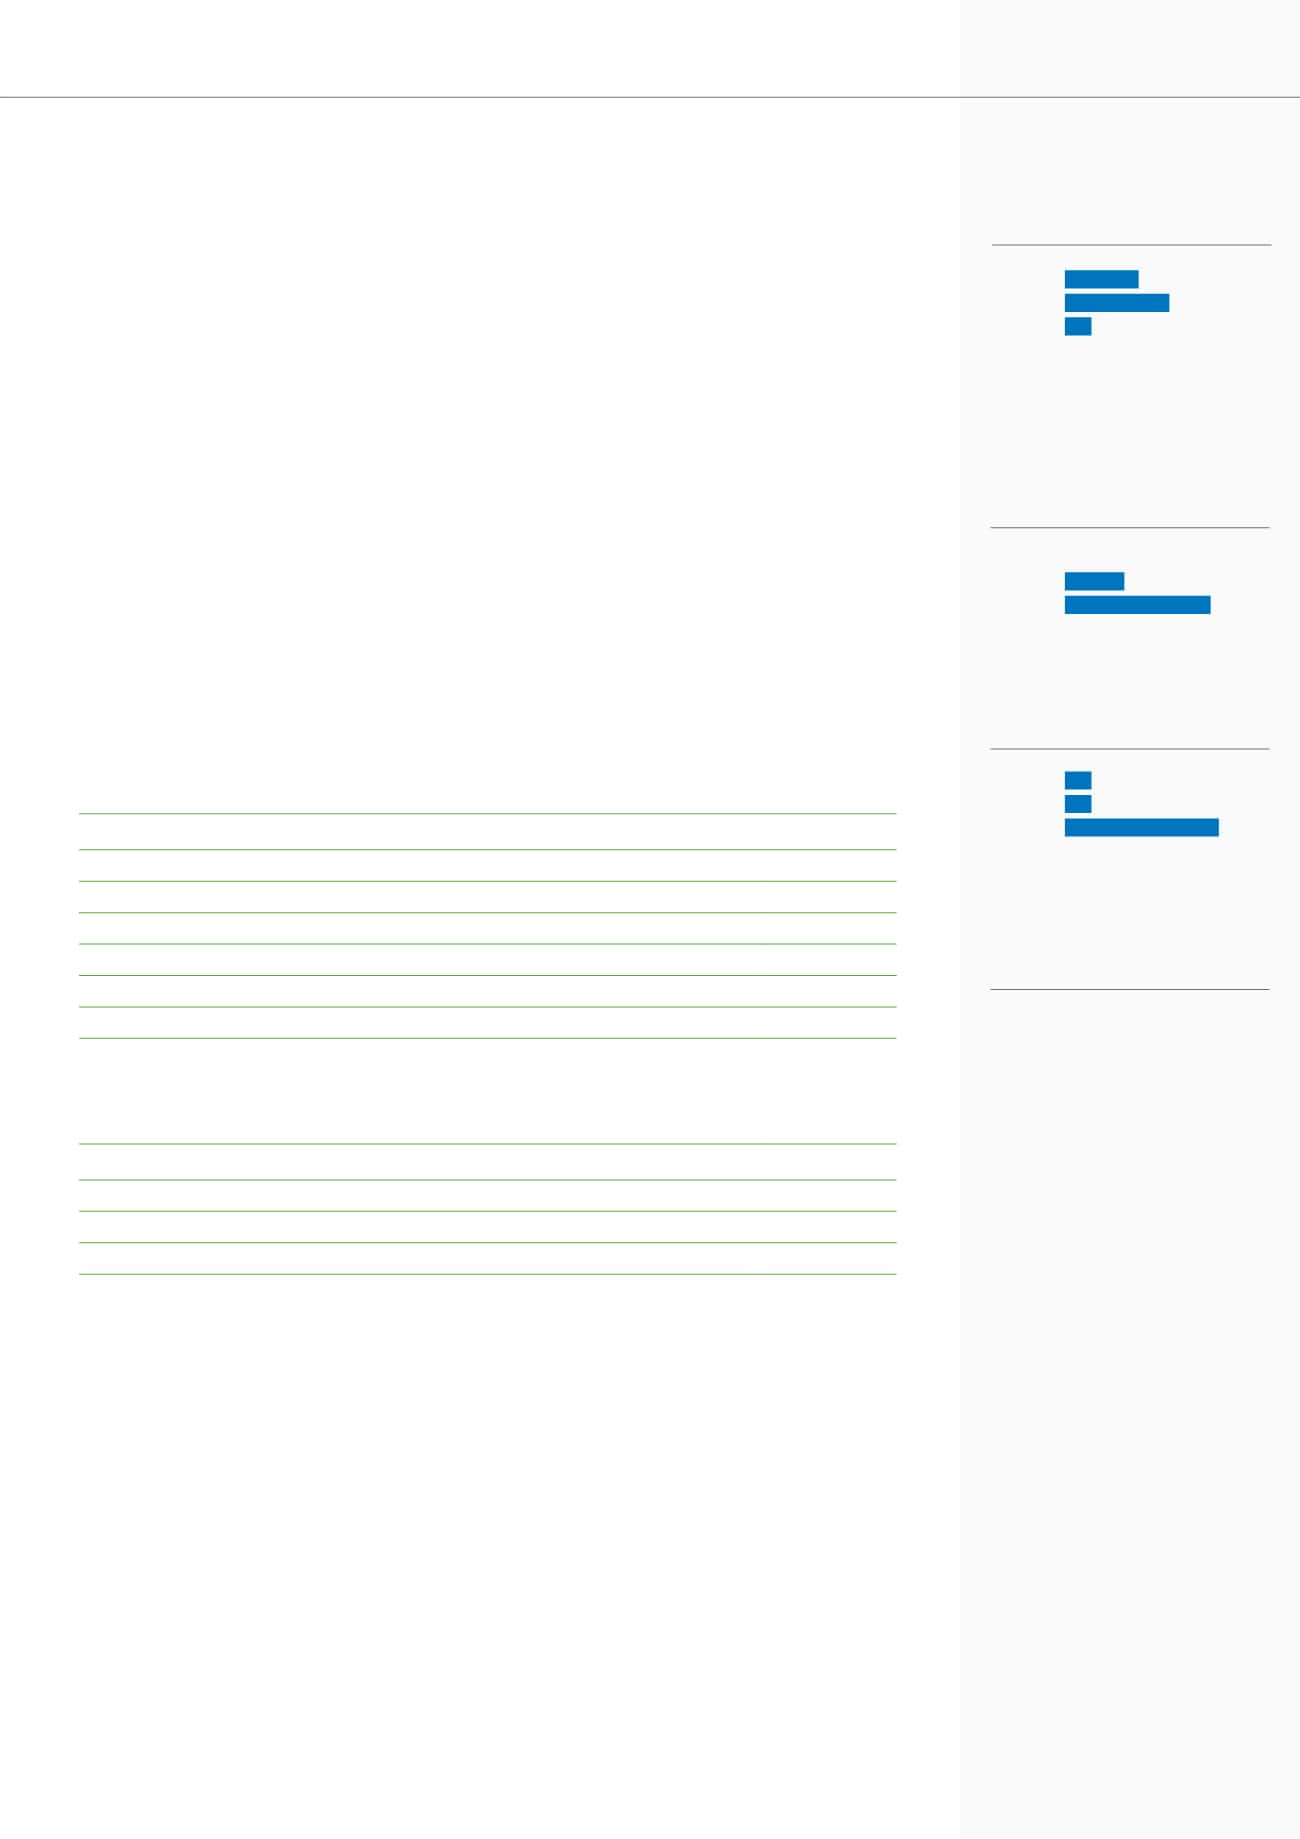
Age distribution of Executive Board
30 and under
31–50
51 and above
29%
71%
0%
KONE Board age distribution
30 and under
31–50
51 and above
13%
75%
13%
Age distribution, Dec. 31, 2015
All KONE employees*
*Excluding United States
30 and under
31–50
51 and above
51%
13%
36%


